An error may occur in which Technical Support will need additional information from your browser if there are issues within the dashboard. There are several ways to do this, however, the most common way is to go through the Browser's Menu tab, then select More Tools>Developer Console.
Keyboard Shortcuts for Common Browsers:
- Internet Explorer: F12 or Ctrl+Shift+J
- Mozilla Firefox: F12 or Ctrl+Shift+i
- Google Chrome: F12 or Ctrl+Shift+J
- Microsoft Edge: F12 or Ctrl+Shift+J
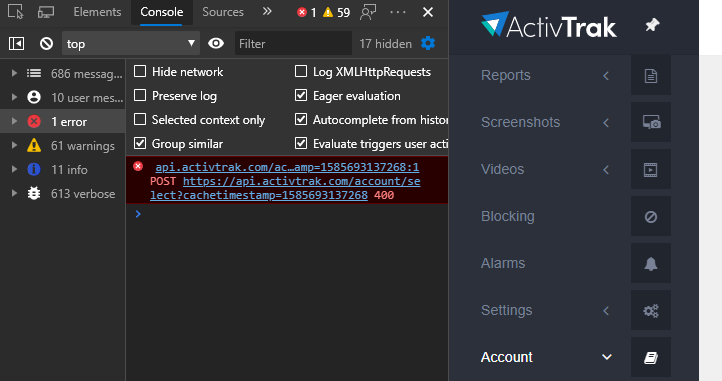
The Developer Console will log error messages in red, similar to the image below. If error messages appear, please screenshot them and send the screenshot to the Technical Support Team member who requested it. Once we receive the screenshot we will review and analyze the error codes to provide a resolution for the issue.